Figures
Figures can be any image, illustration, chart, diagram, code snippet or table referenced in the main flow of the content.
Contrast & color
- Allow for a 3:1 contrast between adjacent colors or insist on a 2px border between objects
- Don’t solely use color to convey meaning: consider patterns like dashed lines or textures to differentiate
Charts & graphics
Most charts and graphics can be constructed in a way to be consumable and interactive with assistive technology.
There are numerous frameworks for creating interactive charts already in existence, but not all of them are accessible. Work with your team to choose a framework with no barriers to people using assistive technology.
When a chart is an image (jpg, png, etc)
If it isn’t possible to present a chart as anything but an image, you must provide an alternate way to provide alternative ways to consume the data.
This could be a table or alt text explaining the outcome of the chart.
Providing a table alternative
Any well constructed table is consumable by people using assistive technology. Tables are often a decent alternative for making complex charts accessible.
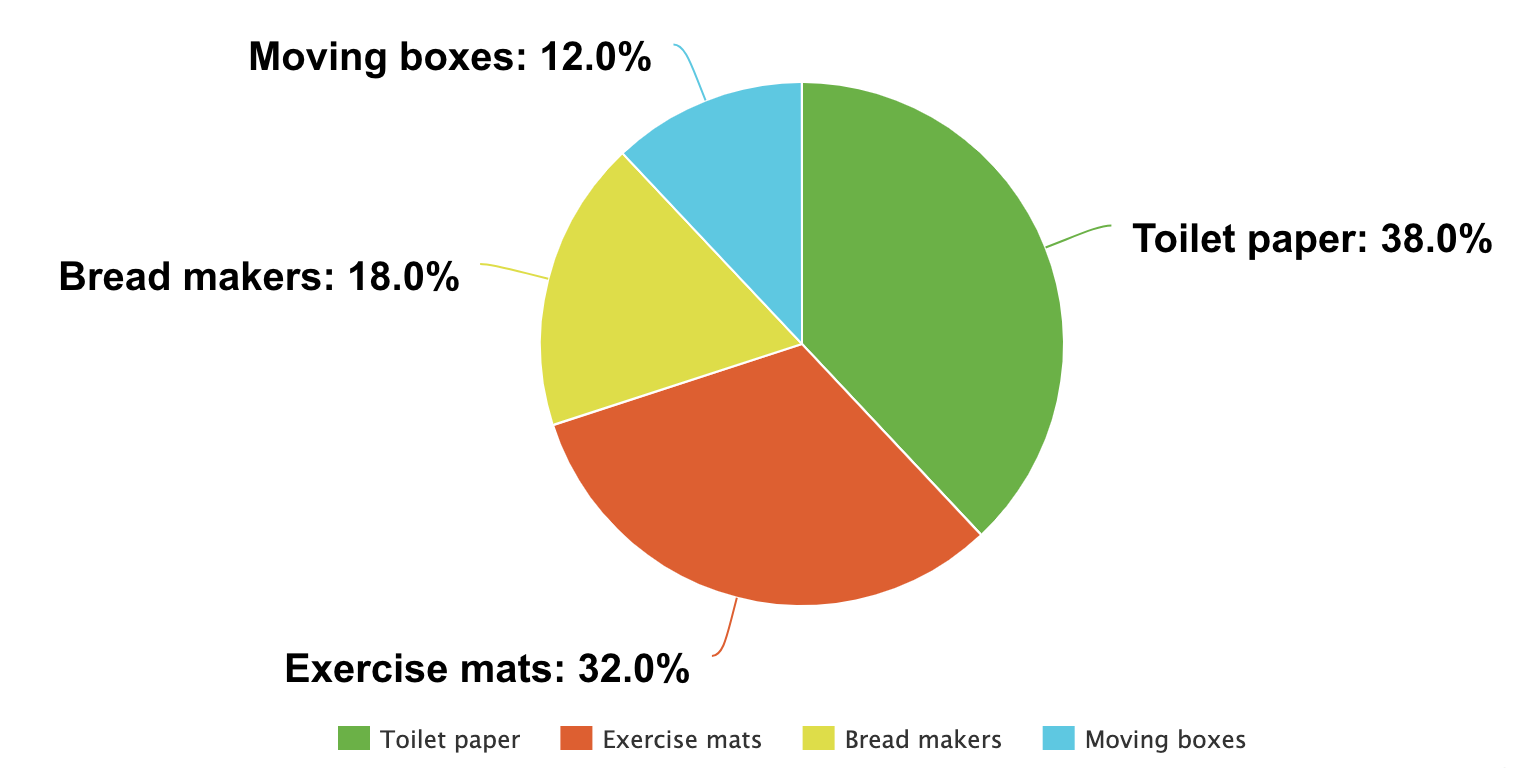
2020 sales
| Toilet paper | Bread makers | Moving boxes | Exercise mats |
|---|---|---|---|
| 38% | 18% | 12% | 32% |
Using alt text to describe a chart image
Sometimes the main point of a chart can be described concisely in alt text.
<img src="pie-chart.png"
     alt="Majority of 2020 sales were toilet paper and exercise mats">
Maps
While maps are obviously a visual artifact, the information they are delivering to the user often translates easily to a different format.
For example, the nearest store to a particular location could also be displayed in a list or table. Service coverage areas could be determined by searching for an address rather than looking at color-coded map layers.
Annotations for figures
- Annotate the tappable area of interactive controls
- Annotate the focusable outline around controls
- Determine which semantic markup could be appropriate for the content by asking, “If this wasn’t a graphic, how would we write this information?”
- Unordered list
<ul> - Ordered list
<ol> - Definition list
<dl> - Table
<table> - Figure
<figure>plus<figcaption>
- Unordered list